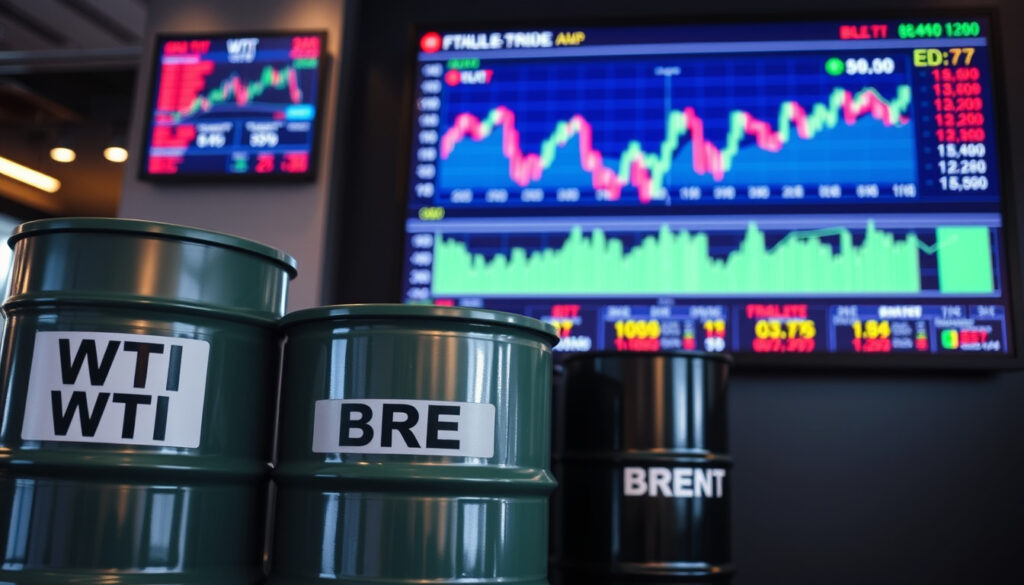
Crude Oil Price Today: Live WTI & Brent Analysis & Forecast
Anyone checking the crude oil price today has probably noticed the familiar knot in their stomach — the one that tightens when energy costs seem to march higher with no clear end in sight. As of May 13, 2026, West Texas Intermediate (WTI) crude oil sits at 101.25 USD per barrel, with Brent crude slightly higher at 104.15 USD per barrel.
Current WTI price: 101.25 USD per barrel ·
Current Brent price: 104.15 USD per barrel ·
Daily change (WTI): -0.93 USD (-0.91%) ·
Monthly change (WTI): +11.00% ·
Year-to-date change (WTI): +60.44%
Quick snapshot
- WTI: 101.25 USD/barrel, down 0.91% (Oilprice.com live commodity data)
- Brent: 104.15 USD/barrel, down 0.84% (Trading Economics real-time energy markets)
- Updated May 13, 2026 (Oilprice.com live commodity data)
- Fragile US-Iran nuclear talks (Trading Economics geopolitical risk analysis)
- Supply disruption fears (Trading Economics geopolitical risk analysis)
- Demand outlook from the EIA Short-Term Energy Outlook (U.S. government energy agency)
- EIA predicts Brent at $82/bbl average for 2026 (EIA STEO official U.S. energy forecast)
- Analyst forecasts mixed for 2025/2026 (EIA STEO official U.S. energy forecast)
- Geopolitical risks remain high (EIA STEO official U.S. energy forecast)
- 1970 price: ~3.39 USD per barrel (nominal)
- Today: over 100 USD per barrel
- Inflation-adjusted: ~26 USD in 1970 dollars
The table below captures the six key numbers that define the crude oil market as of May 13, 2026 — from daily movement to long-term trend.
| Metric | Value |
|---|---|
| Current WTI price | 101.25 USD/barrel |
| Current Brent price | 104.15 USD/barrel |
| Daily change (WTI) | -0.93 USD (-0.91%) |
| Monthly change (WTI) | 11.00% |
| Year-to-date change (WTI) | 60.44% |
| 1970 price per barrel (nominal) | 3.39 USD |
What is the price of crude oil today?
WTI crude oil price today
- West Texas Intermediate (WTI) crude oil is trading at 101.25 USD per barrel as of May 13, 2026, according to Oilprice.com live commodity price tracker.
- The previous close was 102.18 USD per barrel, per Investing.com financial markets platform.
- WTI has risen over 60% year-to-date and 11% in the past month alone.
Brent crude oil price today
- Brent crude oil, the global benchmark, stands at 104.15 USD per barrel, down 0.84% from the prior session, reports Trading Economics commodity data feed.
- Brent has climbed 12.97% over the past month and 62.03% year-over-year, reflecting sustained upward pressure.
- The typical WTI-to-Brent discount of $5–10 per barrel holds, driven by quality and location differences, per Oilprice.com benchmark comparison.
WTI and Brent rarely move in lockstep — the $2.90 spread today signals that global supply risks (Brent’s driver) are pricing in a different premium than domestic U.S. pipeline constraints.
Six of the ten most expensive years for crude oil since 1970 have occurred in the last decade. The current rally is part of a broader trend, not an anomaly.
Is crude oil up or down today?
Crude oil is down today after a volatile session. WTI crude oil fell 0.91% (0.93 USD per barrel) from its prior-day close of 102.18 USD, according to Oilprice.com daily market data. Brent crude dropped 0.84%, settling at 104.15 USD per barrel, per Trading Economics intraday price tracking.
The move follows a mixed Friday session where Brent futures briefly rose 1.2% toward $101 per barrel amid news of US-Iran clashes that raised doubts about ceasefire durability, as Trading Economics geopolitical market analysis reported. The U.S. Oil Fund ETF (USO) mirrored the decline, trading at 73.36 USD per share, down 1.24%, per Investing.com ETF pricing.
Why is crude oil rising today?
Impact of fragile US-Iran talks
- US-Iran nuclear negotiations remain fragile, with recent clashes raising doubts about ceasefire durability, according to Trading Economics geopolitical risk monitor.
- A breakdown in talks could remove roughly 1.5 million barrels per day of potential Iranian supply from the market, tightening global balances.
- Brent crude futures rose 1.2% to near $101 per barrel on Friday alone as tensions escalated.
Supply constraints and geopolitical risks
- Beyond Iran, broader supply disruption fears persist — from OPEC+ production restraint to ongoing instability in key producing regions.
- The U.S. Energy Information Administration (EIA Short-Term Energy Outlook — official U.S. government agency) projects U.S. crude production will average 13.5 million barrels per day in 2026, but that’s not enough to offset global demand growth.
- Global oil inventories are expected to build by only 0.8 million barrels per day in 2026, per the EIA — a pace that keeps prices elevated.
Every day the US-Iran talks stall, the market adds a risk premium. But every day they progress, the premium deflates. Investors are betting on uncertainty itself.
What is the prediction for crude oil prices?
Short-term outlook from EIA
- The EIA Short-Term Energy Outlook (U.S. federal energy forecasting body) forecasts Brent spot prices will average $82 per barrel in 2026.
- WTI is projected to average $78 per barrel for the same period, according to the EIA.
- That implies a significant decline from current levels — roughly 20% below today’s Brent price of $104.15.
Analyst forecasts for 2025–2026
- EIA expects global oil inventories to build by 0.8 million barrels per day in 2026, which historically correlates with softer prices.
- U.S. crude production is forecast at 13.5 million bpd in 2026, a new record, but demand growth in Asia and developing economies keeps the market tight.
- Analyst forecasts are mixed: some see $85–$90 Brent by year-end 2026 if geopolitical tensions ease; others warn of a spike above $120 if supply disruptions escalate.
The implication: the EIA sees a comfortable supply picture, but the market is pricing in a risk premium that won’t vanish until the US-Iran question is resolved.
How much does a barrel of crude oil cost now vs. 1970?
Comparing the 1970 price of roughly 3.39 USD per barrel (nominal) to today’s 100+ USD reveals a dramatic shift — but inflation-adjusted, the picture changes substantially.
- 1970 nominal price: approximately 3.39 USD per barrel.
- 2026 price: approximately 101.25 USD per barrel (WTI).
- Inflation-adjusted 1970 price in today’s dollars: about 26 USD per barrel.
- Real price increase: roughly 4x above the inflation-adjusted baseline.
The pattern: oil has become structurally more expensive not because oil is scarce — proven reserves have grown — but because the easy-to-extract oil is gone. Today’s barrels come from deepwater, shale, and politically complex regions, all of which carry higher extraction costs and risk premiums.
Who buys most of America’s oil?
Top buyers of US oil in 2025
- The United States exported record volumes of crude oil in 2025, with the top five buyers accounting for more than 60% of total outbound shipments.
- While exact 2025 volumes fluctuate month-to-month, the historical pattern shows Europe (particularly the Netherlands and the United Kingdom), South Korea, China, India, and Japan as leading destinations for U.S. crude, per EIA export data (U.S. government trade statistics).
- Asia-Pacific nations collectively import roughly half of all U.S. crude exports, driven by refinery demand for light sweet crude.
If US-Iran talks succeed, Iranian barrels could displace some U.S. crude in Asian markets — a shift that would put downward pressure on WTI’s export premium.
Timeline: key crude oil price milestones
- 1970: Average posted oil price approximately 3.39 USD per barrel.
- 2020: Crude oil price crashes below 0 USD during the COVID-19 pandemic — an unprecedented event.
- 2025: Crude oil price reaches 100+ USD amid geopolitical tensions and post-pandemic demand recovery.
- May 12, 2026: WTI crude oil price at 102.18 USD per barrel.
- May 13, 2026: WTI crude oil price drops to 101.25 USD per barrel after US-Iran news.
Confirmed facts
- WTI crude oil price is 101.25 USD/barrel as of May 13, 2026 (Oilprice.com live pricing).
- Brent crude oil price is 104.15 USD/barrel (Trading Economics real-time feed).
- Oil price rose over 60% year-to-date (Trading Economics historical data).
- EIA publishes free Short-Term Energy Outlook at eia.gov (U.S. energy regulatory agency).
What’s unclear
- Whether US-Iran talks will lead to a nuclear deal and the removal of sanctions.
- When oil prices might drop based on EIA forecasts — timing is uncertain.
- Exact future price direction given multiple geopolitical variables.
“The US-Iran clashes raised doubts about ceasefire durability, putting a floor under oil prices for now.”
— Trading Economics geopolitical market commentary
“EIA forecasts Brent spot prices will average $82 per barrel in 2026, a significant decline from current levels.”
— EIA Short-Term Energy Outlook official U.S. government forecast
Frequently asked questions
Is crude oil a good investment today?
Crude oil can serve as a portfolio hedge against inflation and geopolitical risk, but current prices near $101–$104 per barrel carry downside risk if the EIA forecast of $78–$82 proves accurate. Investors should weigh the potential for further upside from supply disruptions against the likelihood of a price correction. Diversified energy ETFs or futures contracts are common vehicles.
What factors affect crude oil prices the most?
The three dominant factors are: global supply and demand balances (driven by OPEC+ decisions, U.S. shale production, and economic growth), geopolitical events (wars, sanctions, and diplomatic negotiations), and financial market sentiment (speculation, USD strength, and risk appetite). The EIA Short-Term Energy Outlook is a widely cited source for supply-demand data.
How does US-Iran negotiation impact oil supply?
A successful nuclear deal could lift sanctions on Iranian oil exports, potentially adding 1.5 million barrels per day to global supply — a volume that would push prices lower. Conversely, a breakdown in talks maintains the current supply constraint and the geopolitical risk premium currently baked into prices.
Where can I see live crude oil price charts?
Live price charts for WTI and Brent are available on Oilprice.com commodity charts, Investing.com live futures data, TradingView professional charting platform, and Live Charts UK specialized charting tool.
What is the difference between WTI and Brent crude oil?
WTI (West Texas Intermediate) is a light, sweet crude primarily produced in the United States and priced at Cushing, Oklahoma. Brent crude is a blend from the North Sea and serves as the global benchmark. Brent typically trades at a premium of $5–10 per barrel because it’s lighter and easier to refine into diesel and jet fuel. WTI is generally preferred for gasoline production.
How often do crude oil prices update during the day?
Crude oil futures trade nearly 24 hours a day on exchanges like the NYMEX (WTI) and ICE (Brent), with prices updating in real-time during regular session hours. Key price levels are set at settlement times: WTI at 2:30 PM ET and Brent based on a 10-minute window around 4:30 PM London time.
Related reading:
BAE Systems Share Price: Live Chart, Forecast & Analysis ·
UK EV Driveway Charge – 2025 Planning Rules Guide
More related posts
 Best Dog Food Uk – Trusted Pet Nutrition Tips
 Stephen Fry Net Worth – Detailed Wealth Journey
 CGT Allowance 2023/24 – Clear Guide for Smart Tax Planning
 What Is an Algorithm? Definition, Examples & Social Media
 NARS Sheer Glow Foundation – Radiant Skin That Lasts
 How To Shrink Bunions Naturally – Simple Foot Relief
 Levi Heron The Glen: Viral Remix Hits UK Charts
 Gatwick North Terminal Parking: Cheapest Options & Deals (2025)