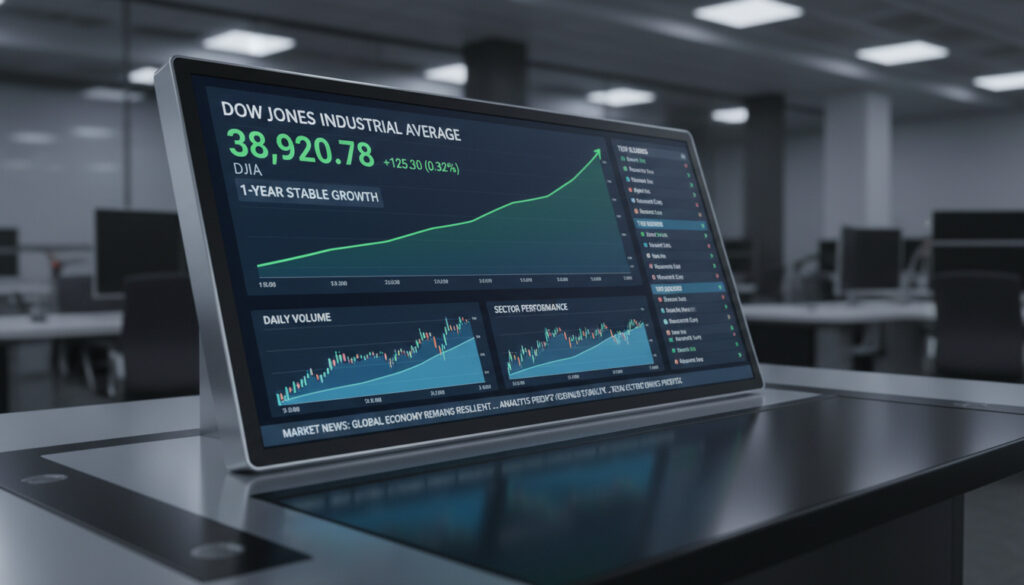
Dow Jones Index Today – Steady Market Insight
The Dow Jones Industrial Average closed at 49,499 points on February 26, 2026, edging up 17 points or 0.03% from its previous session. Activity in the index unfolded against a backdrop of volatile technology stocks and shifting economic sentiment, leaving investors weighing both gains and losses across sectors.
The day’s moderate rise was buoyed by advances in blue-chip companies like Salesforce, American Express, and IBM. Tech sector declines, notably from Nvidia and other semiconductor stocks, introduced headwinds. This subtle balance reflected ongoing market rotation and uncertainty as traders navigated global and economic signals in the broader equities landscape.
What is the current value of the Dow Jones Index today?
49,499 points (February 26, 2026)
+0.03%
Semiconductor sector volatility impacting technology shares
+17 points from 49,482.15 on February 25
- Closing at 49,499, the Dow Jones marked a marginal gain after fluctuating trade.
- Key movements were driven by shifts in both technology and financial sectors.
- Positive contributions came from Salesforce, American Express, and IBM.
- Nvidia, Merck, and Caterpillar registered notable declines, signaling pressure in specific sectors.
- Market momentum for the month stands at a 0.69% increase, with a year-over-year rise of 14.11%.
- Trading volume remained substantial, with over 574 million shares exchanged in a recent session.
- Volatility and sector rotation reflected ongoing market uncertainty and defensive positioning.
| Metric | Figure |
|---|---|
| Current Dow Jones Value | 49,499 (Feb 26, 2026) |
| Daily High/Low (Feb 26, 2026) | 49,341.28 (intraday low reported) |
| Percentage Change (Feb 26) | +0.03% |
| Previous Close (Feb 25) | 49,482.15 |
| Recent High (Feb 20) | 49,625.97 |
| Recent Low (Feb 23) | 48,804.06 |
| 1-Month Change | +0.69% |
| Year-Over-Year Change | +14.11% |
| Major Movers (Feb 26) | Salesforce +3.05%, American Express +2.52%, Nvidia -5.55% |
| Trading Volume (Feb 23) | 574.6M shares |
How has the Dow Jones Index moved today?
Trends and Key Shifts in Market Activity
The Dow Jones oscillated within a narrow range, ultimately climbing by 17 points. While financial and consumer shares posted gains, heavy selling in technology names dampened broader momentum. Salesforce, American Express, and IBM led the advances, with Salesforce rising 3.05%. Conversely, Nvidia fell sharply by 5.55% after reporting results above expectations, a move that coincided with a sector-wide retreat in semiconductors.
The market’s modest overall gain masked a sharp rotation out of technology and into financials and defensive sectors, reflecting ongoing investor caution amid volatile earnings reactions. Source
Further perspective is available on Bloomberg Markets, which offers additional insight into the day’s trading dynamics.
Short-Term Patterns and Notable Swings
Trading over the week revealed swings from losses to gains. February 23 marked a 1.66% drop, while the index rebounded with back-to-back gains of 0.76% and 0.63% on February 24 and 25. The relatively flat movement on February 26 capped a period of volatility but maintained the index near historical highs.
Component Movers: Biggest Gainers and Losers
Beyond Salesforce and American Express, IBM posted a 1.83% improvement. On the downside, Merck fell 2.63% and Caterpillar lost 1.84%. Broader indices trended lower, with the S&P 500 dropping 0.5% and the Nasdaq falling over 1% on the same day.
What economic and global factors are influencing today’s Dow Jones performance?
Headline Economic Drivers
Volatility in semiconductor stocks played a central role, highlighted by Nvidia’s steep drop despite strong reported earnings. Investor sentiment shifted towards financials, as broader technology selling weighed on indices. The S&P 500 and Nasdaq both declined, contributing to a defensive trading mood. Market observers cited the contraction in high-growth segments as a reaction to previously surging valuations and profit-taking.
As technology stocks faltered, investors rotated capital into financial and value-oriented sectors, seeking steadier returns and reduced risk in the short term.
Related Indices and Volatility Metrics
The US500 index closed at 6,896.24, marking a 0.54% daily loss, and the Nasdaq 100 dropped 1.16%. The VIX, a common measure of expected volatility, ticked up to 18.55. Volume levels remained high, signaling elevated activity amid choppy sentiment.
Rising volatility indexes indicate growing uncertainty despite modest daily index gains, underlining the importance of monitoring sector-specific developments.
News and Macro Developments
There were no major single-day news shocks. Market participants instead responded to a series of earnings releases and signal shifts, with particular attention paid to rotation trends and sector-specific results. Broader market context includes economic data releases, but no single catalyst dominated trade on February 26. For additional context, insights from Reuters Markets have been noted.
How does today’s performance compare to historical trends?
Short-Term and Long-Term Context
Following a sharp drop on February 23 and subsequent gains, the Dow finished the latest session just below the recent all-time high. The previous week’s range shows fluctuating closes from 48,804.06 to 49,625.97. February produced significant volatility, with nearly 6,000 points spanning its monthly range.
Historical Extremes and Recent Highs
The Dow’s close remains within sight of a fresh record. February 20’s 49,625.97 marked a new high, consistent with the index’s long-term upward trajectory. Year-on-year, the 14.11% climb is notable, far exceeding average annual gains over longer periods, according to official tracking.
Technical and Volume Signals
Volume, as reported on February 23, totaled 574.6 million shares, pointing to engaged participation. The figures situate today’s result as part of a robust, yet choppy, upward trend for equities—punctuated by rotation between technology and defensive stocks.
Timeline of Dow Jones Index Movements: February 20–26, 2026
- : Dow closes at 49,625.97, new all-time high. (Source)
- : Index drops sharply to 48,804.06 (-1.66%). (Source)
- : Recovery with gain to 49,174.50 (+0.76%). (Source)
- : Further gain, closing at 49,482.15 (+0.63%). (Source)
- : Marginal uptick to 49,499 (+0.03%), reflecting sector rotation. (Source)
Certainty vs. Uncertainty in Today’s Dow Jones Figures
| Established Information | Uncertainties |
|---|---|
| Closing value of 49,499 on February 26, 2026 confirmed by multiple official sources. | Real-time figures during after-hours trading are not reflected in available data. |
| Sectors contributing to the day’s movement, such as tech and financials, are clearly identified. | The precise duration and depth of tech sector weakness remain unclear. |
| Volume and component gain/losses are documented by NYSE and trading platforms. | Forecasts for the next session rely on emerging economic data, not yet released. |
| Confirmed movement in related indices: S&P 500 and Nasdaq signaled sector-wide trends. | Broader market sentiment for the remainder of the week cannot be verified at this time. |
Dow Jones Index Today: Broader Market Background
The Dow Jones Industrial Average represents 30 of the largest publicly traded companies in the United States. Fluctuations in its value often reflect changing investor sentiment, shifts in economic outlook, and responses to global news. The latest trends continue a pattern of notable volatility, driven by earnings, economic data, and sector performance.
Index figures are compiled at the end of each trading day and published by official sources including the NYSE and leading financial platforms. For more detailed analysis of stock market indices and historical movement, refer to research.
Key Sources and Commentary
“The modest uptick in the Dow conceals substantial sectoral stress, with technology facing persistent outflows despite robust earnings from industry leaders.”
Trading Economics Report, Feb 26, 2026
“Daily volumes remain high, indicating both institutional and retail engagement even as broader equity indices experience heightened volatility and sector shifts.”
NYSE Official Data
Dow Jones: Today’s Takeaway and Next Steps
The Dow Jones Index today reflected a market at a crossroads—balancing modest overall growth against significant sector volatility. As investors assess the implications for upcoming sessions, paying attention to sector trends and fresh economic releases remains crucial. For further exploration, consult comprehensive research on market indices and macroeconomic influences.
Frequently Asked Questions
What time does the market open and close?
The New York Stock Exchange operates from 9:30 a.m. to 4:00 p.m. Eastern Time on standard trading days.
How often is the Dow Jones updated?
The index updates in real time during market hours, with official closing values published daily by the NYSE and related financial sites.
What do the percentage changes mean for investors?
Percentage changes show the magnitude of movement, helping assess market direction and daily volatility in the Dow Jones.
Where can I find more detailed market analysis?
In-depth analysis is available from financial platforms and through official publications; consider exploring research resources.
How are global events impacting the Dow Jones today?
Financial markets react to a mix of earnings, economic news, and shifts in global sentiment, which affect the Dow’s daily trajectory.
Additional market commentary can be found on Investopedia.
More related posts
 British Airways First Class Review 2025: Is It Worth the Cost?
 Ming-Na Wen: Ethnicity, Martial Arts, Mulan, Filmography
 Two Conditions That Are Often Misdiagnosed as Carpal Tunnel Syndrome
 How Many People Are in the World 2025 – Key Figures and Projections
 Smallest Country in the World: Vatican City Facts & List
 Pearl (2022 Film) – Psychological Horror Analysis
 Golf Clothes for Men: Brands, Dress Codes & What to Wear
 Alex James: Blur Bassist, Cheese Farmer & Net Worth 2024